Monitoring
The Monitoring structural pattern is a derivative of the Fault Diagnosis architectural pattern and the Fault Treatment strategy pattern in the original resilience design pattern specification (Fig. 32) [B24]. It detects existing faults in the system that already have or have not been activated to an error. The following describes the Pattern and its application in the System Scope and in the Service Scope of the INTERSECT federated ecosystem for instrument science. Note that the Pattern description uses the terms system, subsystem, and service in an abstract way, while the System Scope and the Service Scope map those terms to the INTERSECT federated ecosystem.
Pattern
- Problem
Not knowing the presence, root cause, and impact of a defect or anomaly in the system causes a lack of corrective action at design or run time and may eventually result in an error or failure.
- Context
The pattern applies to a system that has the following characteristics:
The system has well-defined parameters that enable a monitoring system to discover the presence of a defect or anomaly in the behavior of the monitored system.
The interaction between the monitored and monitoring systems is bounded in terms of time.
The monitoring system has the capability to readily analyze the behavior of the monitored system to identify a defect or anomaly.
- Forces
The interactions between the monitoring and monitored systems may interfere with the operation of the monitored system, specifically its performance.
While the frequency and duration of these interactions must be minimized to reduce the monitoring overhead, the interactions must be able to detect/infer a defect or anomaly in the monitored system.
The monitoring system’s data gathering and defect/anomaly detection/inference must be in time to prevent the activation of an error and a subsequent failure.
The diagnostic resolution, i.e., the degree of accuracy of the fault diagnosis, must be high to be effective.
- Solution
The pattern enables the discovery and treatment of a defect or anomaly in the system, which either has the potential to activate or already has activated to an error and potentially a subsequent failure. The pattern supports methods that attempt to recognize the presence of a defect or anomaly within a monitored system. It prevents its activation or enables its containment and mitigation by notifying the monitored system about a fault with location and type information, such that the anomaly or defect is removed before or after it results in an error or a failure. The solution requires a monitoring system, which may be a subsystem of the monitored system or an external independent system, to observe key parameters of the monitored system and to notify the monitored system when these parameters deviate.
The pattern makes an assessment on what may potentially or actually be wrong with a system. The diagnosis entails making inferences based on the observed behavior of a system and narrowing the search for the root cause of the fault. The assessment is based on the operating behavior of the monitored system. The monitoring system may approach the problem using two strategies:
- Effect-Cause Fault Diagnosis
This approach entails observation of the parameters of the overall system for anomalies. When a parameter deviates from a range of values that may be considered as fault-free operation, the monitoring system attempts to determine the root cause. The monitoring system logically partitions the system into subsystems and progressively eliminates the subsystems known to be fault-free. Through this process, it narrows the search for the fault in the system.
- Cause-Effect Fault Diagnosis
This approach is based on a set of known fault models and the monitoring system comparing the system parameters with a model developed using fault-free system operation, or using simulations. When observed parameters deviate from the fault-free system operation model, the presence, location, and the type of fault may be inferred.
The components of this pattern are illustrated in Fig. 33.
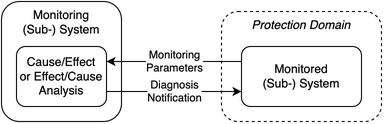
Fig. 33 Monitoring pattern components
- Capability
The pattern provides fault detection in the monitored system at design or run time, before it eventually results in an error or failure, or after activation, by identifying deviations in monitored parameters. This pattern enables containment and mitigation of a future, imminent or present error or failure in the monitored system through detection and by notifying the monitored system about a fault with location and type information. A system using this pattern is able to detect faults and take corrective action at design and run time. This pattern provides fault detection in the monitored system at design or run time, before it eventually results in an error or failure or after activation, by identifying deviations in monitored parameters and performing effect-cause or cause-effect fault diagnosis.
The pattern enables containment and mitigation of a future, imminent or present error or failure in the monitored system through detection and by notifying the monitored system about a fault with location and type information based on effect-cause or cause-effect inferences. The flowchart of the pattern is shown in Fig. 34, the state diagram in Fig. 35, and its parameters in Table 4.
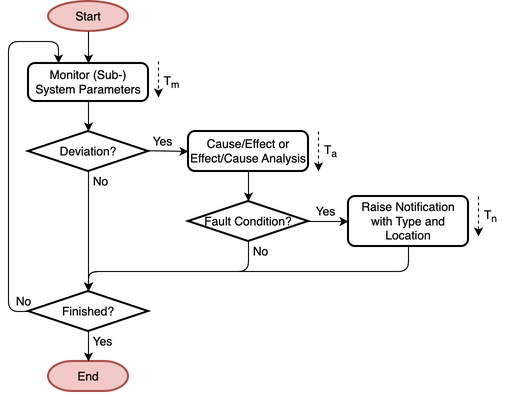
Fig. 34 Flowchart
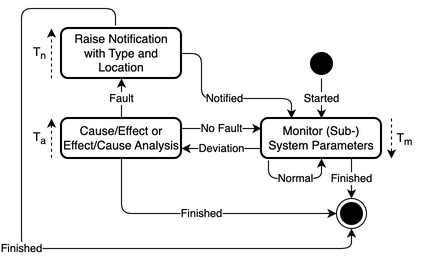
Fig. 35 State diagram
Table 4 Monitoring pattern parameters Parameter
Definition
\(T_{m}\)
Time to monitor (sub-) system parameters, including wait and probe times
\(T_{a}\)
Time to perform the cause/effect or effect/cause analysis
\(T_{n}\)
Time to raise notification with type and location
- Protection Domain
The protection domain extends to the monitored system.
- Resulting Context
The discovery and treatment of a defect or anomaly in the system that has the potential to activate are enabled, which can be used to prevent, contain and mitigate an error or a failure in the system. The structural pattern requires identifying system parameters that indicate the presence of a fault. The overall system design must include a monitoring system, which introduces design complexity. When the monitoring system is extrinsic to the monitored system, the design effort may be simplified, but the interfaces between the monitoring and monitored systems must be well-defined. When the monitoring system is intrinsic to the design of the monitored system, design complexity increases due to the need to interface the monitoring and monitored subsystems.
A trade-off exists between interference with the operation of the monitored system caused by the frequency and duration of the interactions between the monitoring and monitored systems, and the ability to detect/infer a defect or anomaly in the monitored system. A high performing solution reduces the interference, while maintaining a reasonable ability to detect/infer a defect or anomaly.
The pattern may be used in conjunction with other patterns that provide containment and mitigation and require or can make use of fault detection. It detects the presence of a defect or anomaly and reports it, but doesn’t act to remedy the fault. Based on the monitored system design and accessibility of the parameters selected for observation, the diagnosis may not be very precise and may sometimes give no indication. An efficient implementation performs effect-cause or cause-effect analysis with a reasonable degree of precision and recall.
- Performance
In the case when the monitoring system is not a part of the monitored system, the monitoring system doesn’t impact the task’s’ total execution time \(T_{E}\). The error/failure-free performance \(T_{f=0}\) is \(T_{E}\).
When the monitoring system is a part of the monitored system, then it can impact the task’s total execution time by \(\delta\), the ratio of available resources utilized by monitored system. The error/failure-free performance \(T_{f=0}\) is defined by:
\[\begin{aligned} T_{f=0} = \frac{T_{E}}{1-\delta} \end{aligned}\]The performance under errors/failures \(T_{f!=0}\) is defined by the error/failure-free performance \(T_{f=0}\), plus the time \(T_{n}\) to raise \(N\) notifications with type and location. Assuming constant time for \(T_{n}\), \(T_{f!=0}\) can be defined as:
\[\begin{aligned} T_{f!=0} = T_{f=0} + N T_{n} \end{aligned}\]- Reliability
As the pattern only detects errors or failures, the reliability remains the same with an assumed constant probabilistic error/failure rate \(\lambda\) (or its corresponding inverse, the mean-time to interrupt (MTTI) \(M\)).
\[\begin{aligned} R(t) = e^{-\lambda T_{f!=0}} = e^{-T_{f!=0}/M} \end{aligned}\]- Availability
The availability of the pattern can be calculated using the task’s total execution time without the pattern \(T_{E}\) and performance under errors/failures \(T_{f!=0}\). \(T_{E}\) is the planned uptime (PU) \(t_{pu}\). \(T_{f!=0}\) is the planned uptime (PU) \(t_{pu}\), the scheduled downtime (SD) \(t_{sd}\), and the unscheduled downtime (UD) \(t_{ud}\).
\[\begin{aligned} A = \frac{T_{E}}{T_{f!=0}} = \frac{t_{pu}}{t_{pu}+t_{ud}+t_{sd}} \end{aligned}\]
- Examples
Hardware sensors in the processors, on the board, and in the power supply provide real-time operational data about temperature, fan speeds, and voltages. Software sensors in the Linux operating system (OS) offer real-time operational data about processor and memory load. The data is made available by sensor interface tools, such as Intelligent Platform Management Interface (IPMI) [B42], such that a monitoring tool, like the Ganglia Monitoring System [B43], can aggregate it with time stamps in a central database. The monitoring tool can be configured to send a notification when a certain threshold value for a sensor is exceeded.
A heartbeat monitoring tool checks the liveness of a message passing interface (MPI) process in the system by regularly sending a message and waiting for a reply [B44]. If no message is received back within a certain time period, the MPI process is considered failed and the MPI programming model runtime software is informed. This heartbeat monitoring is performed between all MPI processes, where all MPI processes watch each other. A message sent by the application can be used as a liveness request or reply message.
An MPI tracing tool, like Vampir [B45], is used to capture detailed time-stamped information about an application’s MPI messages at execution time. The created MPI message trace contains time-stamped information about when an MPI function was called and when it was completed, such that it can be analyzed for inefficiencies in the MPI application’s messaging behavior. A common root cause for MPI application scaling limitations is the inefficient use of MPI collectives. The MPI application developer is informed by the tool about such situations.
- Rationale
The pattern enables a system to discover and treat a defect or anomaly in the system that has the potential to activate and become an error or failure or already has activated. It relies on a monitoring system to observe the monitored system, identifying deviations in monitored parameters. A discovered defect or anomaly is treated by raising a notification about a fault with location and type information, permitting the monitored system to provide containment and mitigation. A key benefit of this pattern is preemptive discovery of faults in the system, before they are activated and result in errors or failures. Preventive actions taken upon such discovery avoid the need for expensive error/failure recovery, compensation, or correction actions.
System Scope
In the context of INTERSECT Systems, Subsystems, and Services, this pattern can be applied to INTERSECT systems and subsystems. It would be primarily applied to an entire infrastructure system and its subsystems, but it could also be applied an entire logical system that spans across multiple infrastructure systems. It could be applied to a logical subsystem of an infrastructure system only.
Service Scope
In the context of INTERSECT Systems, Subsystems, and Services, this pattern can be applied to an INTERSECT service. If it is applied to a group of services, then this is typically within the System Scope.
Microservice Scope
In the context of the INTERSECT Microservices Architecture, this pattern can be applied to an INTERSECT microservice. If it is applied to a group of microservices, then this is typically within the Service Scope.